Product Build · 4 min read
How I Built a Home Savings Planner: Down Payment & Affordability Calculator
How I built a calculator that plans monthly savings, timeline and affordability for home buyers, including rising prices, closing costs and couples.
 By Ali Iftikhar ·

Buying a home is a number you can plan, not a guess. But most home-buying calculators only answer one narrow question, usually "what will my monthly payment be?", and leave you to work out the rest.
I built the Home Savings Planner to answer the questions people actually have before they buy: how much should I save each month, how long will it take, and what can I afford? This is how it works and the decisions behind it.

The problem: a moving target
A savings goal sounds simple. Pick a price, pick a down payment, divide by the months you have. The trouble is that home prices do not stand still while you save. If prices rise each year, the amount you need keeps climbing, and a plan that looks fine on paper can quietly fall short.
The planner treats the goal as a moving target. It works out the monthly amount, the date, or the price that actually works once rising prices and the interest your savings earn are both taken into account.
Three questions, one tool
Instead of a wall of fields, the planner starts with a single question: what do you want to find out? You pick one of three modes:
- How much should I save each month? You choose the date you want to buy by, and it works out the monthly amount.
- How long until I can buy? You enter what you can save each month, and it works out the date.
- What home can I afford? You enter a monthly housing budget, and it works out the highest price that fits, including taxes and insurance.
The sample report on the site shows how this reads: for a $425,000 home with 10% down and a three-year plan, the answer is a monthly saving of $1,281.
Five short questions, about three minutes
The flow is a five-step wizard that takes about three minutes. Short steps matter more than they seem. Every extra field costs you people, so each question has to earn its place. Where a number is hard to guess, the interface explains it in plain language instead of assuming financial knowledge.
The whole cost, not just the down payment
A real plan has to cover more than the down payment. The report includes:
- Down payment and the closing costs, broken into lender fees, services, government fees and prepaids.
- Reserves, the cash cushion lenders like to see.
- The monthly payment: principal and interest, taxes, insurance and mortgage insurance.
- How heavy your debts will feel, as a plain-language health check.
Charts show the savings journey against the rising price, where your closing cash goes, and what owning costs each month.
Inside the report dashboard
After the five steps, the planner opens a report dashboard. The screenshots below use the built-in first-time-buyer sample, so every number is sample data, not a real person's.
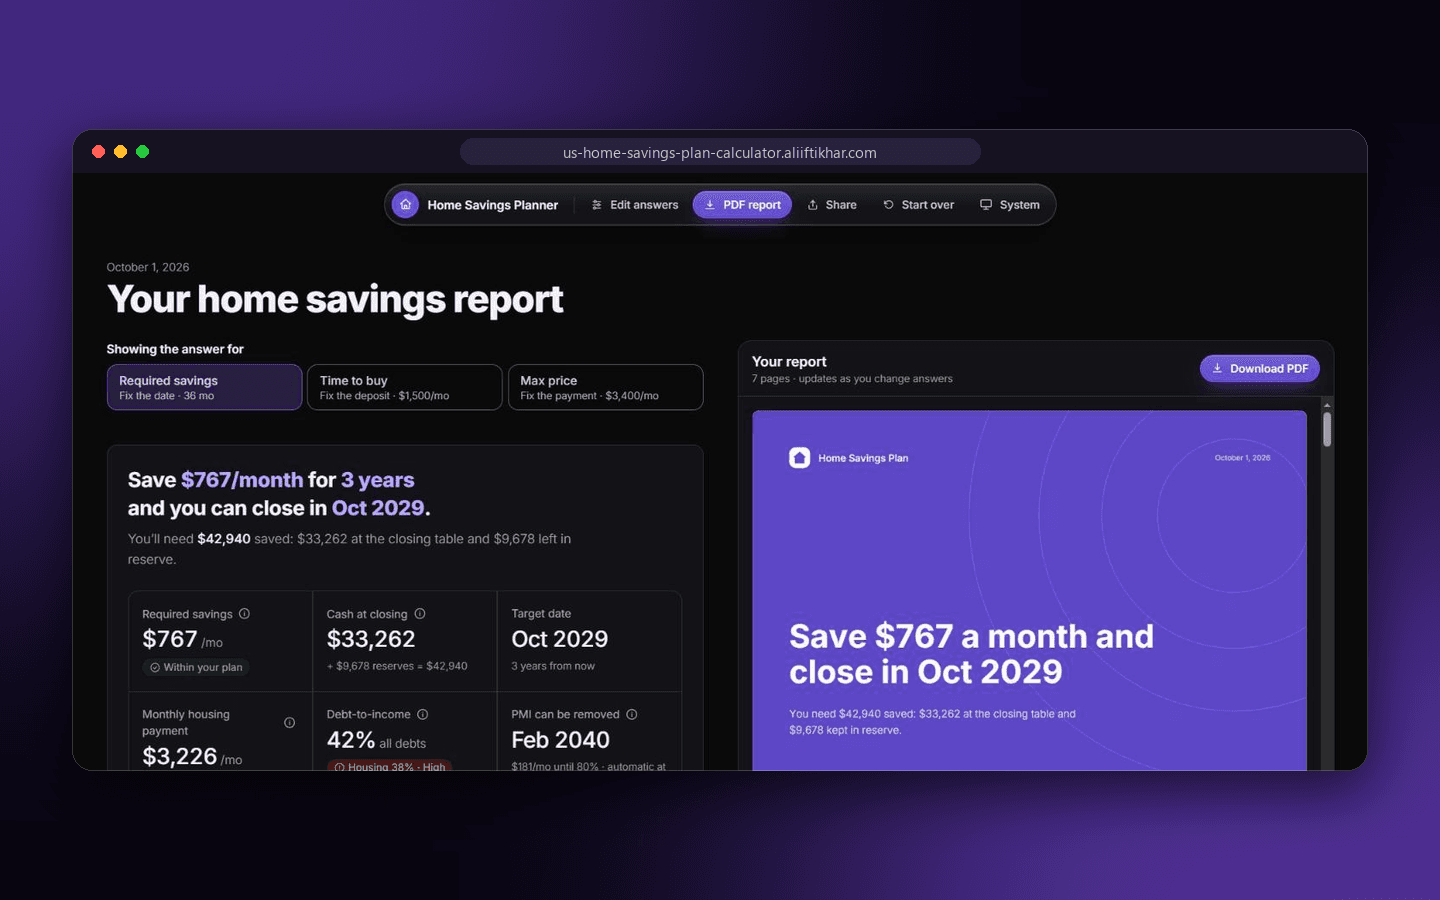
The answer comes first, in one plain sentence: save $767 a month for three years and you can close in October 2029. Right under it sit the numbers that matter:
- Required savings: $767 a month, flagged as within the plan.
- Cash at closing: $33,262, plus $9,678 of reserves, for $42,940 in total.
- Monthly housing payment: $3,226, split into principal and interest, tax and insurance, and mortgage insurance.
- Debt-to-income: 42% of income, with labels for how heavy the housing share and total debts feel.
- When mortgage insurance can be removed: February 2040, with the monthly cost until then.
The dashboard also tells you hard truths. In this sample it warns that the payment is likely too high for the income, because most lenders stop approving around 43 to 45% total debt. An honest warning is more useful than a reassuring number.
A live preview of the seven-page PDF report sits on the right and updates as you change your answers, with a download button. Three tabs switch the question the report answers: required savings, time to buy, or maximum price.
Scenario lab
The scenario lab puts six routes to a home side by side, so you can compare choices instead of imagining them:
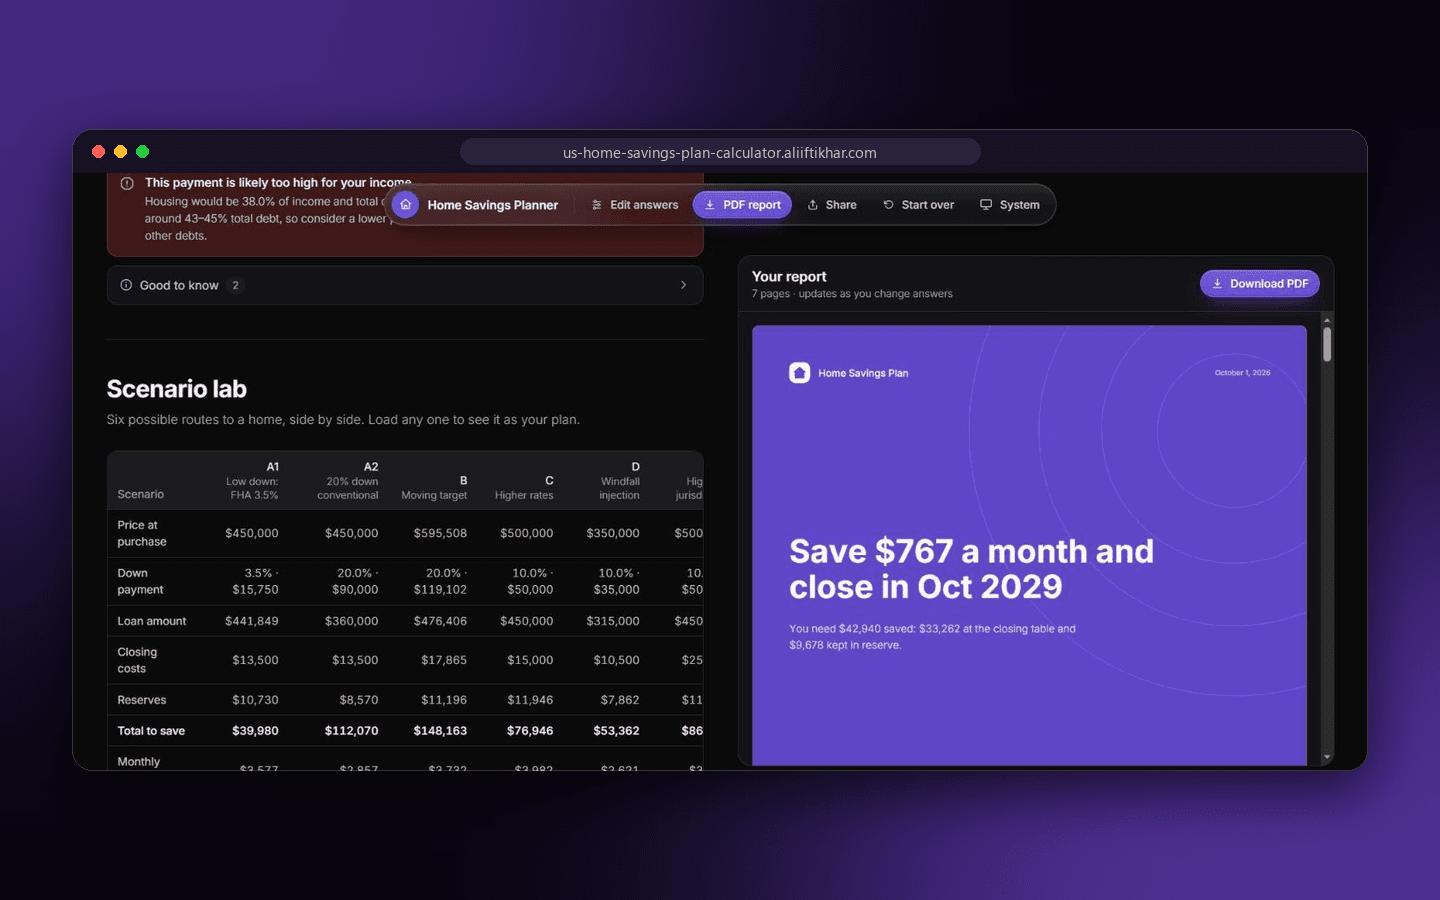
Each column changes one thing, such as a low-down-payment loan versus 20% down, a higher interest rate, a windfall, or a more expensive closing-cost state. The rows show the price, down payment, loan amount, closing costs, reserves, total to save, monthly housing cost and the monthly saving needed. A Load button turns any column into your active plan.
The idea behind the math
The core of a savings plan is a standard calculation. In simplified form, if you save P each month at a monthly interest rate r for n months, your savings grow to:
future savings = P x ((1 + r)^n - 1) / rThe target is not fixed, because the price grows too:
future price = price x (1 + growth)^yearsThe planner then solves for whichever value you left open: the monthly amount, the time, or the price. This is a simplified illustration of the approach, since the real report also layers in closing costs, reserves and insurance.
Planning as a couple
Many people buy with a spouse or partner. The planner lets each person enter their own income, debts, savings and credit score in a separate profile, then combines them. Because lenders price a joint loan on the lower credit score, the planner does the same, and it suggests a fair split of the monthly saving.
Privacy by design
Financial details are sensitive, so the planner is built to keep them yours. Your answers stay in your browser. Profiles are never saved, and share links never include them. The report can be downloaded as a tidy PDF to share with a partner or a lender.
What I learned
- Answer first, detail second. One plain sentence that tells you what to do beats a table of numbers.
- Make the assumptions visible. Notes explain how things like property tax are estimated, so the numbers feel trustworthy.
- Privacy is a feature. Not storing personal details removes a whole category of worry.
- Estimates need honesty. The tool is for planning and is not financial advice, and it says so.
Try it
You can open the calculator and get your own number in about three minutes. If you are planning a calculator, a fintech tool or any product where clear numbers and trust matter, get in touch. I build products like this, from the math to the interface.
You might also like how I think about multi-tenant SaaS architecture and why AI-driven products need real cost thinking.